Recent Industry Data Bodes Well for Aftermarket
Market conditions continue to favor the aftermarket: economic conditions present a challenging environment for consumers to purchase a new vehicle, especially with ongoing inflation, rising interest rates, and uncertainty in the market. A few considerations:
- Inflation has tapered over the last several months to 6.0% in February, but consumers are still feeling pinched for everyday purchases;
- Vehicle inventories have gradually recovered since 2022 and are expected to replenish inventory stocks throughout this year, according to S&P Global Mobility;
- Used vehicle prices have reduced somewhat, while new car prices continue to rise: S&P Global Mobility reports that the average price of a light vehicle was $45,700 in 2Q2022 – 36% higher than 1Q2018; the Manheim Used Vehicle Value Index was 238.6 for March 2023, slightly higher than recent months, but lower than in March 2022 (243.9);
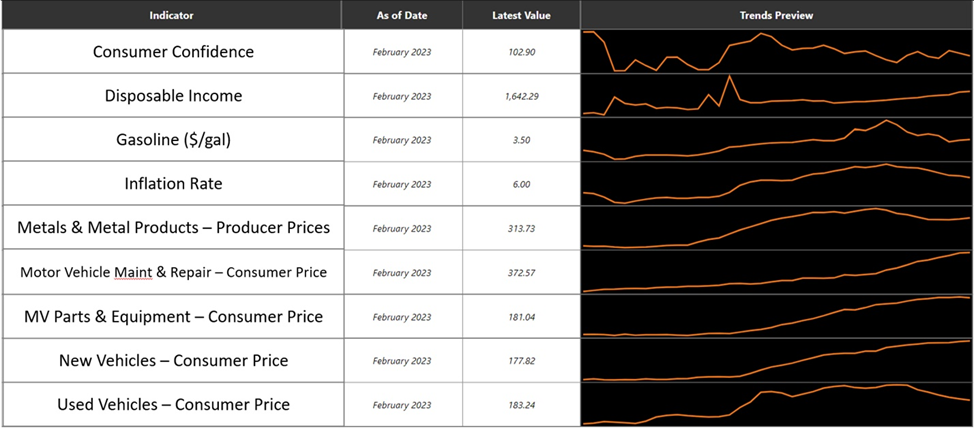
- Automotive parts prices have risen steeply since the pandemic began – the U.S. Department of Labor’s indexed consumer price for motor vehicle parts and equipment has risen to 181.04 in February from 167.99 in February 2022 and 149.32 in February 2021;
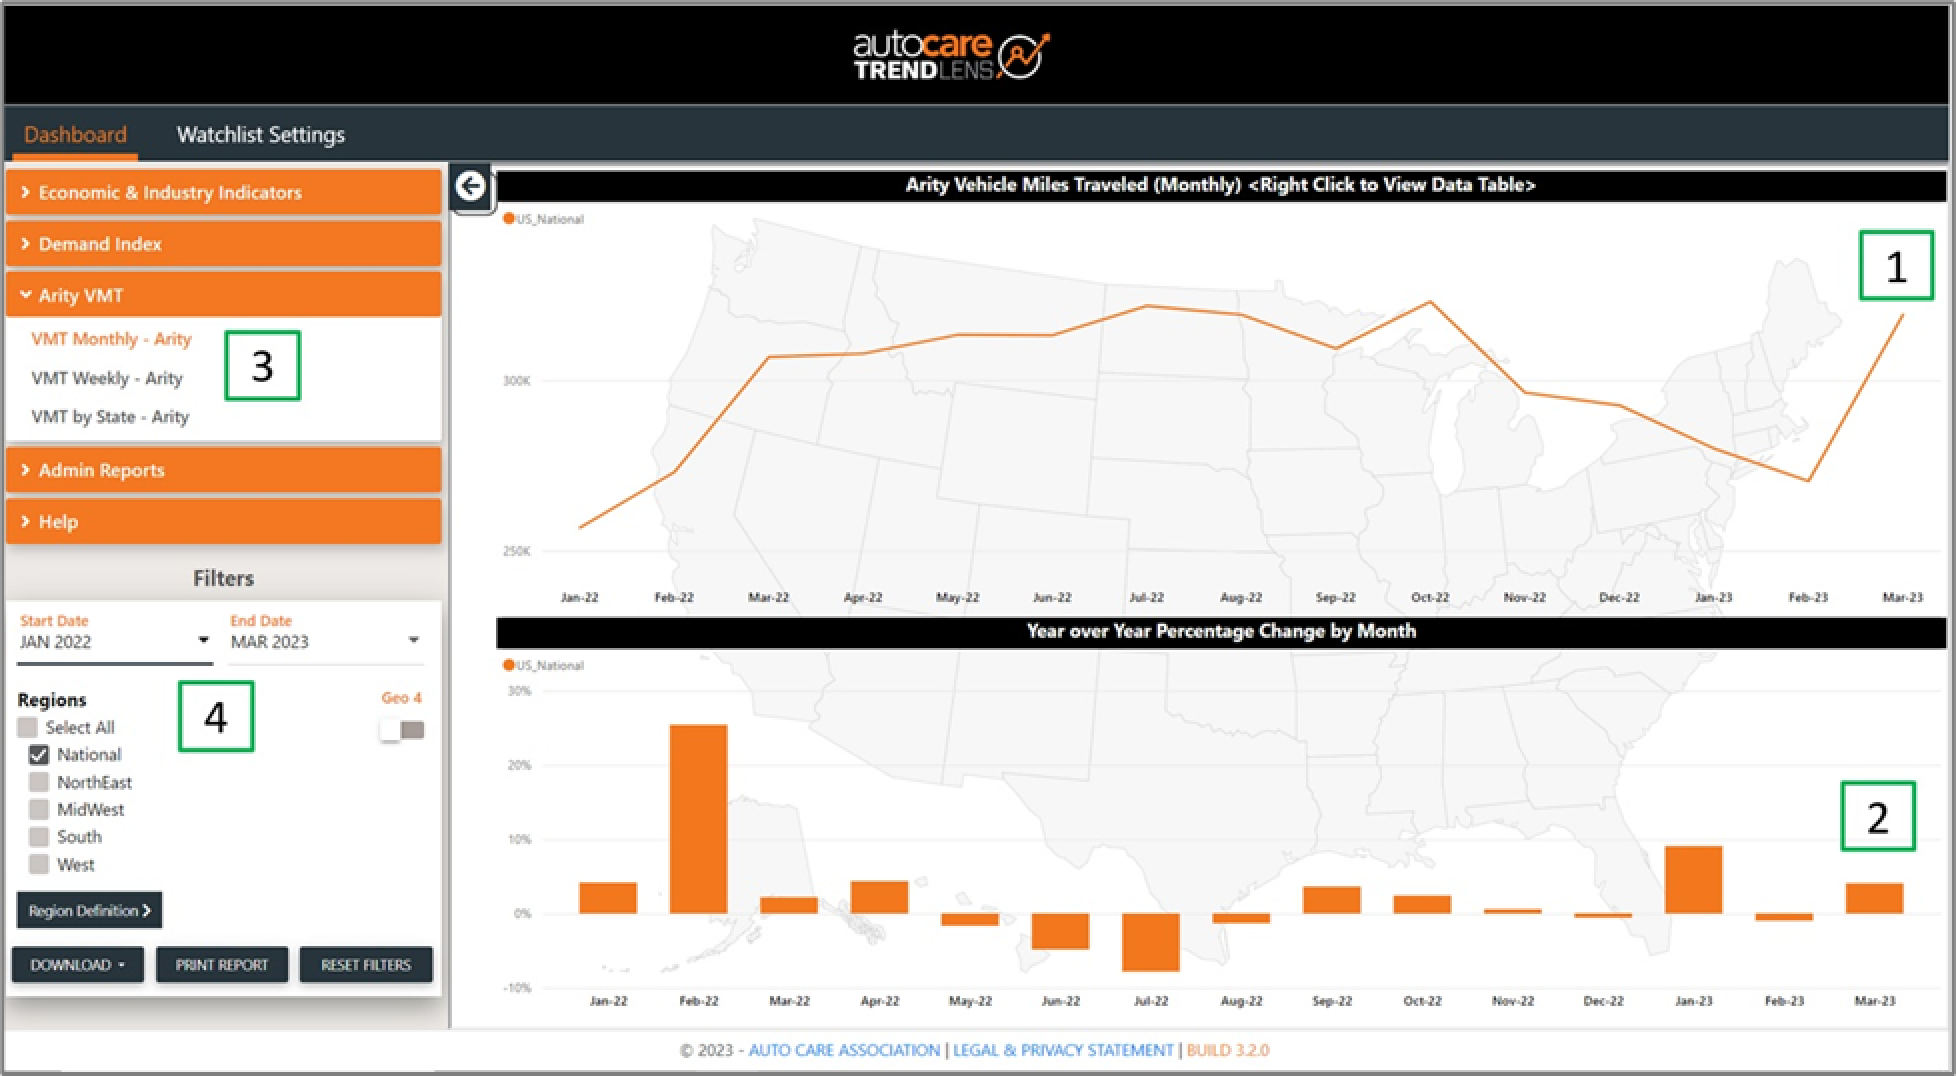
- Vehicle Miles Traveled (VMT) continues to be robust – as pictured below, U.S. VMT for March was 319.3 billion (1), 4.1% higher than March 2022 (2).

As many of our regular TrendLensTM users know, you can line up any of our economic and industry indicators in the Dashboard view of TrendLensTM – a few indicators mentioned above are plotted below from January 2020 to February 2023:

Consumers looking to acquire a vehicle still face competing forces between purchasing a new vehicle, purchasing a used vehicle, or simply keeping their current vehicle – the chart below highlights a few factors that may favor purchase of used and new vehicles, or potentially delay purchases:
| Favors used vehicle purchase | Favors new vehicle purchase | Indeterminate |
|
|
|
Owning any vehicle, new or used, is arguably more expensive. Used vehicle prices are lower, but repair costs for any vehicle are generally higher:
- Higher parts prices – the most recent Labor Department’s index of motor vehicle parts and equipment consumer price is 181.04 for February and has stayed above 180 since October 2022.
- Higher labor rates – average hourly rates for automotive maintenance and repair workers have increased from $20.72 in January 2022 to $23.79 in January 2023.
- High inflation – inflation came down to 6.0% in February and has decreased steadily from 9.1% in June.
Economic uncertainty and malaise continue as the vehicle fleet continues to age:
- Consumer confidence has held fairly stable – most recently reported at 102.90 in February and staying between 95.30 and 108.60 in the last 12 months, but recent bank failures may shake consumer confidence in financial institutions and loan provider stability.
- New and used vehicle sales may be negatively impacted – total light vehicle sales fell to 1.03 million in January, on par with the 992,000 sold a year earlier.
- People hold onto cars for a long time – the average age of light vehicles was 12.2 years as of Jan. 1, 2022 and has steadily increased over the past decade – we expect it to increase again when we release updated figures in the upcoming edition of the Factbook.
Future consumer behavior and industry conditions are hard to forecast, but you can continue to use TrendLensTM to your advantage:
- View monthly data for more than 40 economic and industry indicators across consumer behavior, general industry, aftermarket labor, aftermarket sales, industry output, weather and more;
- Use indicator data as inputs into your own forecast models and industry analyses – MarketView subscribers can download the data for easier processing;
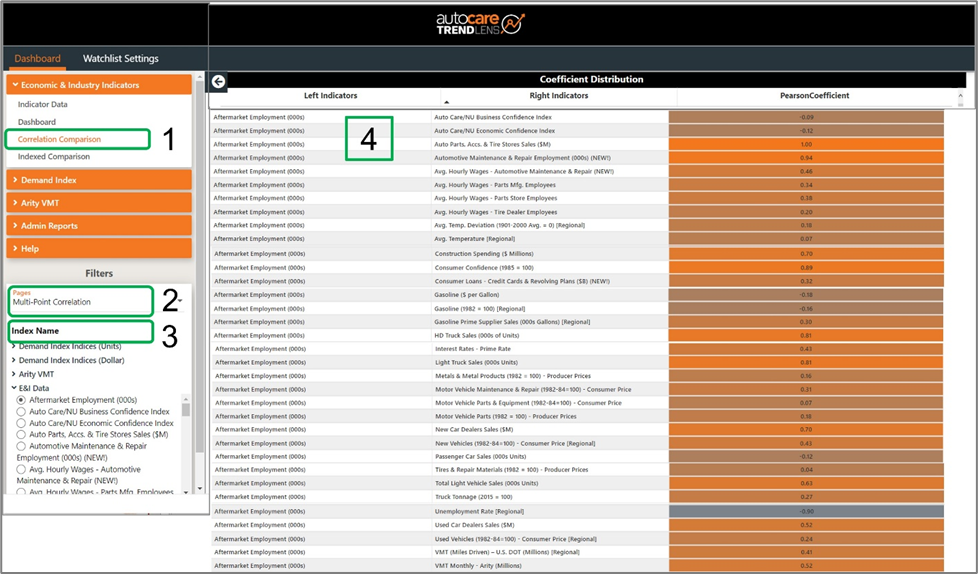
- Take advantage of our new correlation feature – as illustrated below, this is in the “Correlation Comparison” tab (1) – select “Multi-Point Correlation (2), the indicator of interest (3), and see how it correlates to all other indicators on the right side of the screen (4); Demand Index subscribers will see their product lines appear here as well) list of correlation coefficients for all other indicators. You can click on the top of the “Pearson Coefficient” column to sort the indicators ascending or descending. The more orange the cell, the more positively correlated; the more gray, the more negatively correlated.


Michael Chung, Director, Market Intelligence
Ready to dive into market research? I provide the industry with timely information on key factors and trends influencing the health of the automotive aftermarket and serving as a critical resource by helping businesses throughout the supply chain to make better business decisions. More About Me

Market Insights with Mike is a series presented by the Auto Care Association's Director of Market Intelligence, Mike Chung, that is dedicated to analyzing market-influencing trends as they happen and their potential effects on your business and the auto care industry.
More posts
Content
-
[WATCH] Driver Behavior Trends and Their Impact on Parts and Service Opportunities
March 17, 2022This webinar analyzes driving behavior at the national, state, and local levels. Gain insights into: consumer behavior; driving patterns; and potential impacts on parts replacement, service and repair scheduling, vehicle age, and the car parc.
-
[WATCH] 2022 Business Outlook: Top Emerging Opportunities and Challenges
February 4, 2022This webinar explores need-to-know emerging opportunities and challenges for the coming year: current status of supply chain issues and what to expect in the year ahead and more.
-
[WATCH] How to Use Vehicle Miles Traveled to Better Your Bottom Line in 2022
December 3, 2021Vehicle Miles Traveled has been respected for years as a key indicator of aftermarket opportunities. Historically, planning has been limited to directional indicators but now aftermarket businesses can leverage more detailed insights on geographic differences as well as vehicle differences to more effectively take advantage of aftermarket opportunities.
